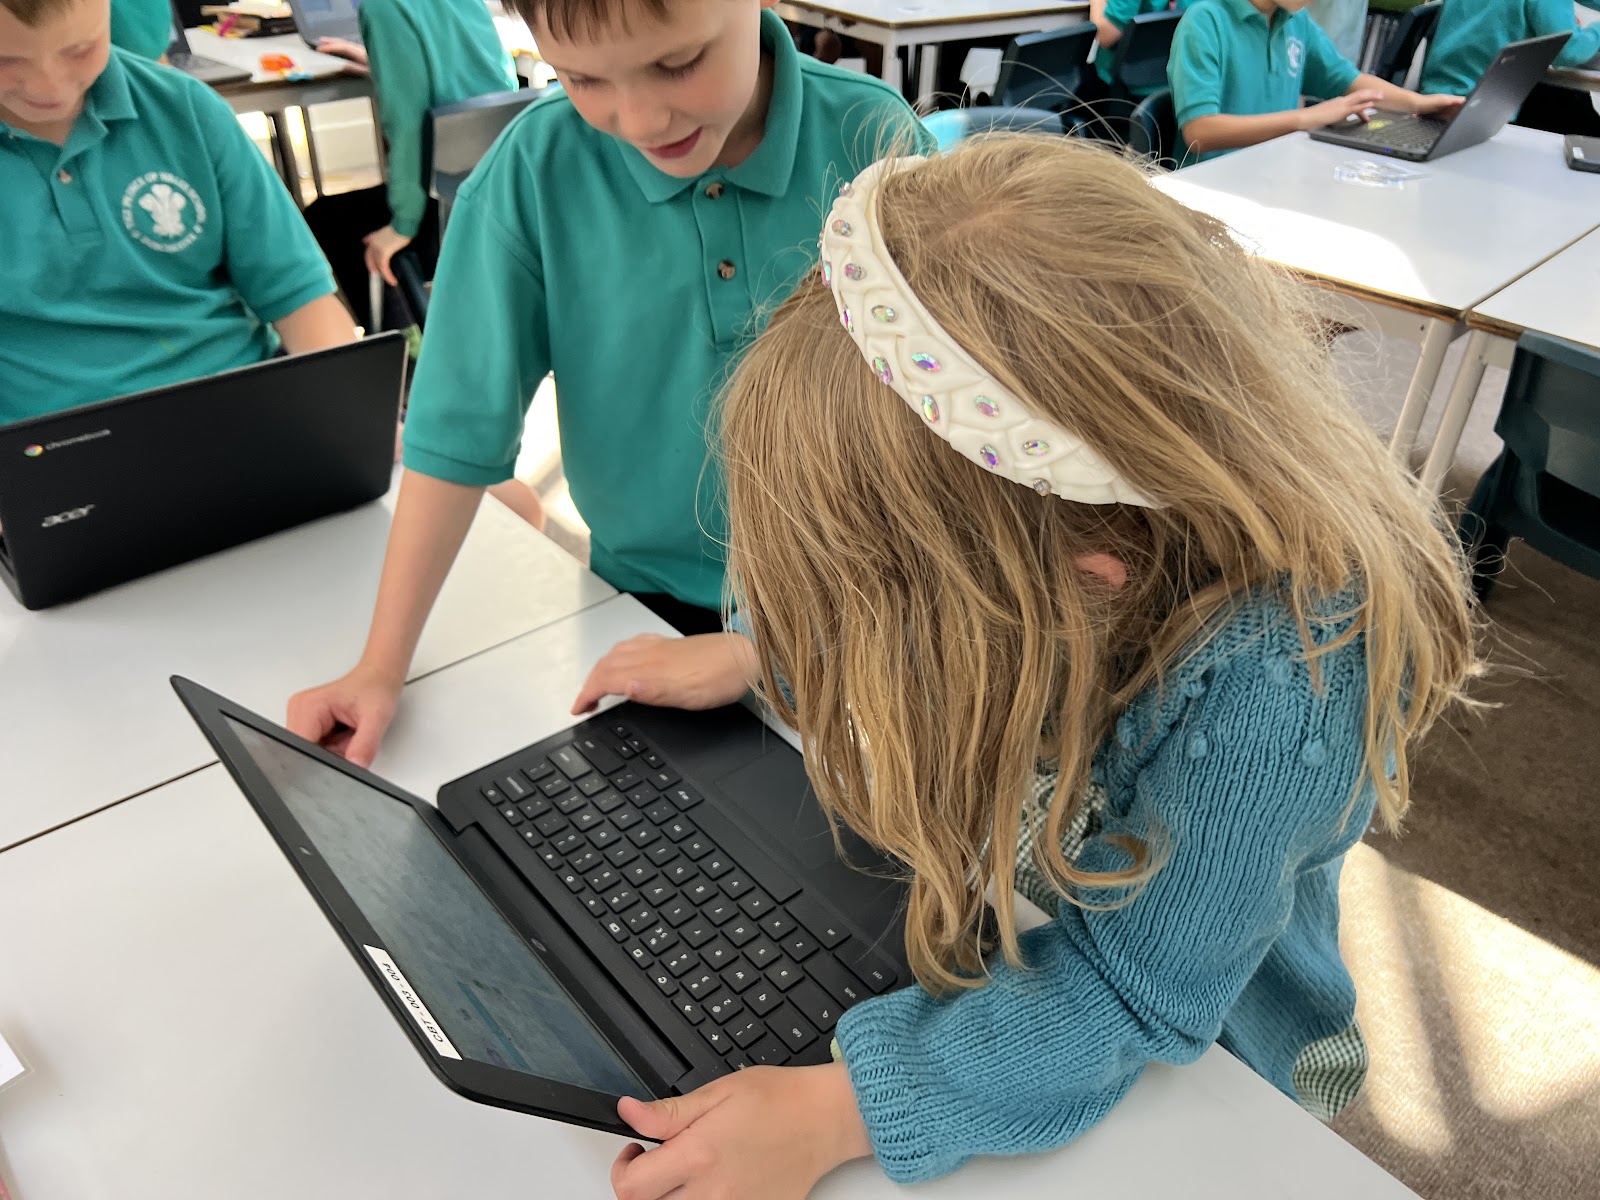
This week in Computing, Year Three began an exciting new unit from Purple Mash called Graphing (Unit 3.8).
In our first lesson, we explored how data can be collected, organised, and represented visually using a digital tool called 2Graph.
To bring this to life, we carried out a simple data collection activity together. The children voted for their favourite colour, and we recorded the results as a tally chart. Once our data was collected, it was time to head into Purple Mash’s 2Graph tool. Using this fantastic program, the children learned how to input data and watched as it was instantly transformed into colourful, easy-to-read graphs.
They experimented with different graph types, including bar charts and pictograms, and were able to explain what their graphs showed. It was a great opportunity to practise not just computing skills, but also maths vocabulary and interpreting data.
We finished the lesson by reflecting on what we had learnt and discussing how digital graphs can help people make decisions.
We’re looking forward to developing these skills further in the coming weeks as we delve deeper into data handling and digital literacy. Well done Year 3!


No comments:
Post a Comment